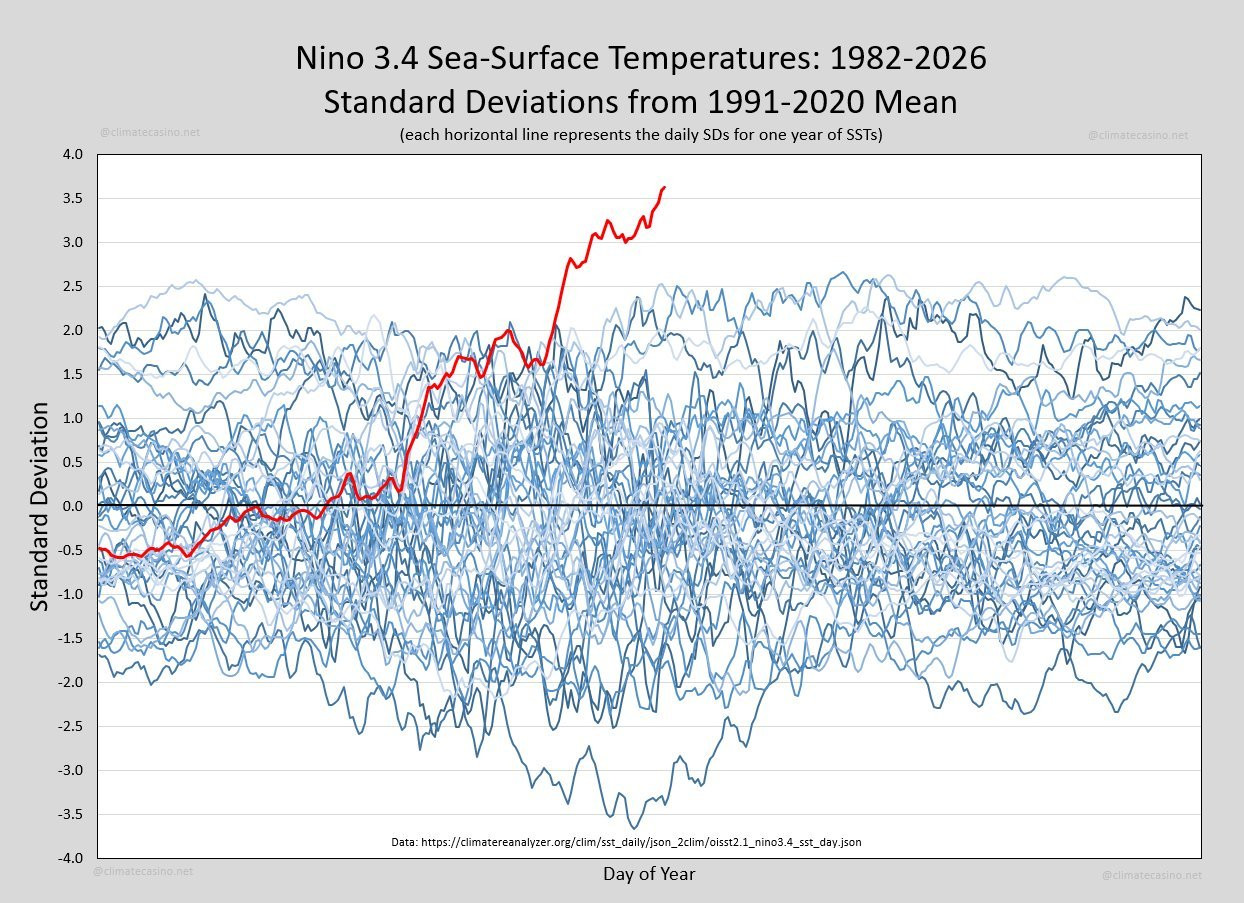
Every so often the Earth produces a signal that is impossible to ignore. This graph is one of them. It shows sea-surface temperatures in the Niño 3.4 region of the equatorial Pacific, one of the most important parts of the Earth's climate system. Each blue line represents a different year since 1982. The red line is this year. It doesn't just set a new record. It has departed entirely from the range of previous observations.
The Graph That Should Be Front-Page News

Discussion